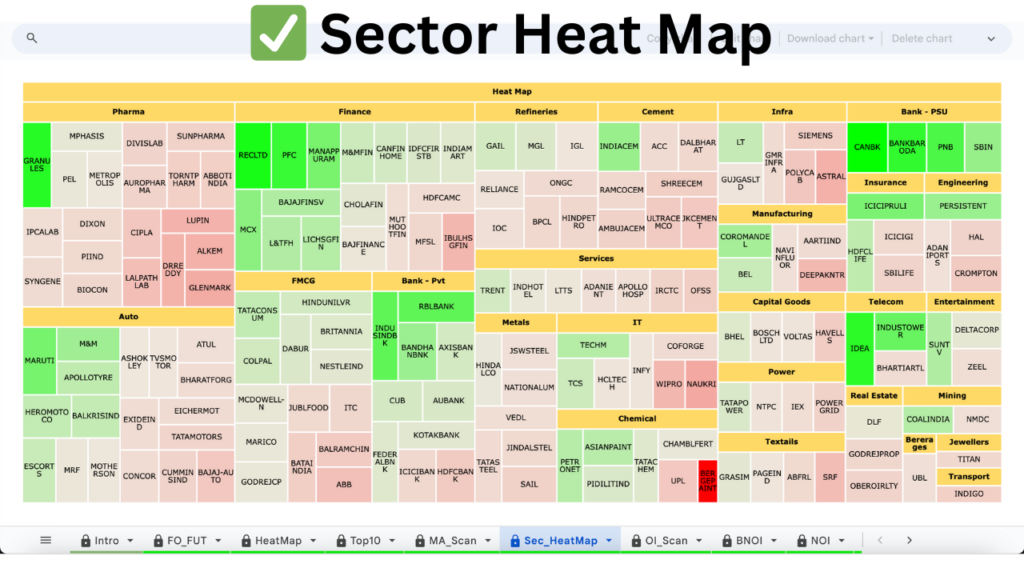
What Is a Sector Heat Map?
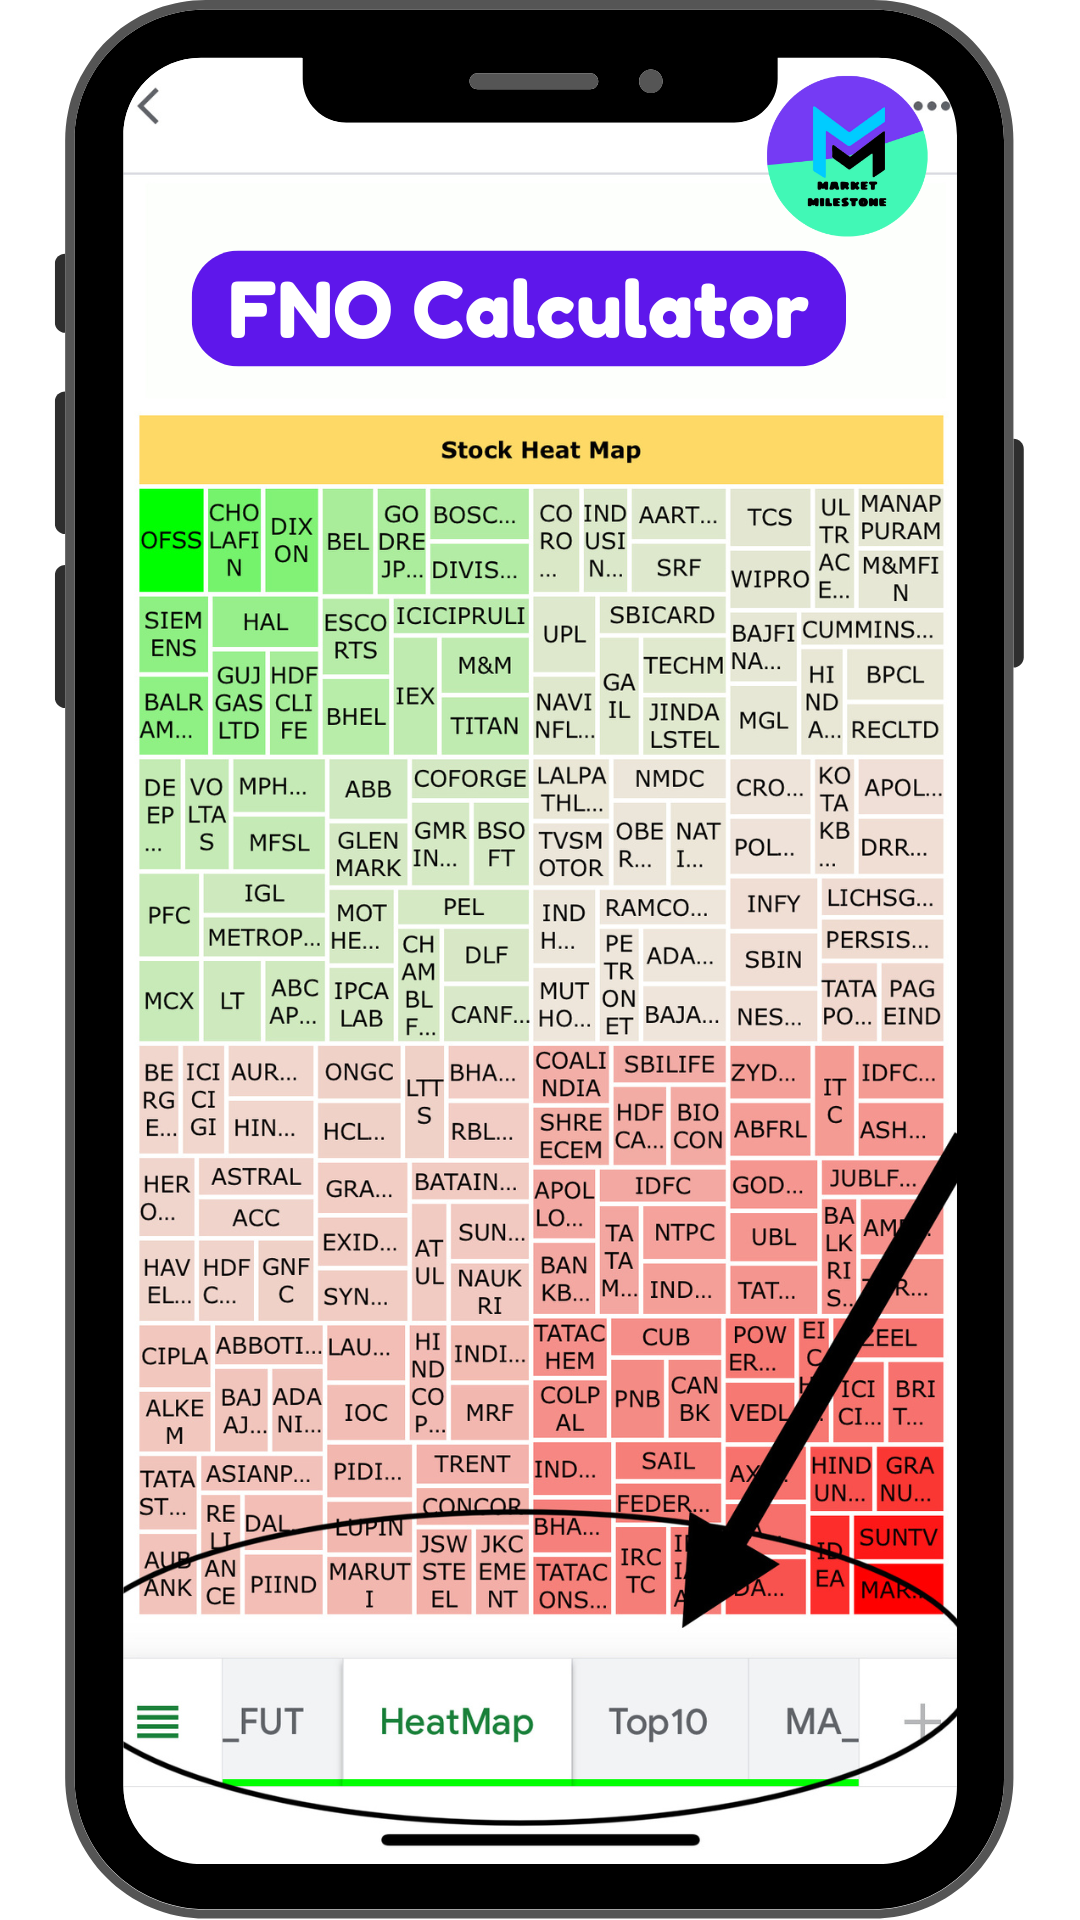
A Sector Heat Map is a visual tool that represents the performance of various sectors and stocks within the market. It uses a color-coded system, where green represents positive performance and red indicates negative performance. The intensity of the color reflects the magnitude of the change, making it an easy-to-read overview of market activity.
Key Components of a Sector Heat Map
- Sectors: Divided into categories like technology, healthcare, finance, and energy.
- Stocks: Each sector is represented by individual stocks, usually displayed as blocks.
- Performance Metrics: Metrics like percentage change, volume, and market cap are often included.
- Color Coding: Green shades for gains and red for losses, with deeper shades indicating more significant changes.
Understanding the FNO Calculator
The FNO Calculator is a specialized tool designed for traders in the futures and options market. By entering specific trade parameters, such as strike price, premium, and lot size, it calculates:
- Profit and loss scenarios
- Break-even points
- Margin requirements
- Impact of market volatility
When paired with a sector heat map, the FNO Calculator adds a layer of depth to sector analysis, enabling traders to make more informed decisions.
Benefits of Using Sector Heat Maps and FNO Calculator Together
- Comprehensive Market Insights
Sector heat maps provide a high-level view of market trends, while the FNO Calculator delivers detailed trade-specific analysis. Together, they offer a well-rounded perspective.
- Improved Decision-Making
The combination of visual trends from heat maps and numerical insights from the FNO Calculator helps traders make data-driven decisions with greater confidence.
- Time Efficiency
Heat maps simplify the process of identifying sector performance, while the FNO Calculator streamlines trade calculations. This saves time and allows traders to act quickly.
- Enhanced Risk Management
The FNO Calculator’s ability to simulate different market scenarios complements the sector heat map’s trend insights, enabling better risk mitigation.
How to Use Sector Heat Maps and FNO Calculator for Sector Analysis
- Identify Sector Trends with Heat Maps
Begin by analyzing the sector heat map to identify top-performing (green) and underperforming (red) sectors. Focus on sectors with significant changes in performance.
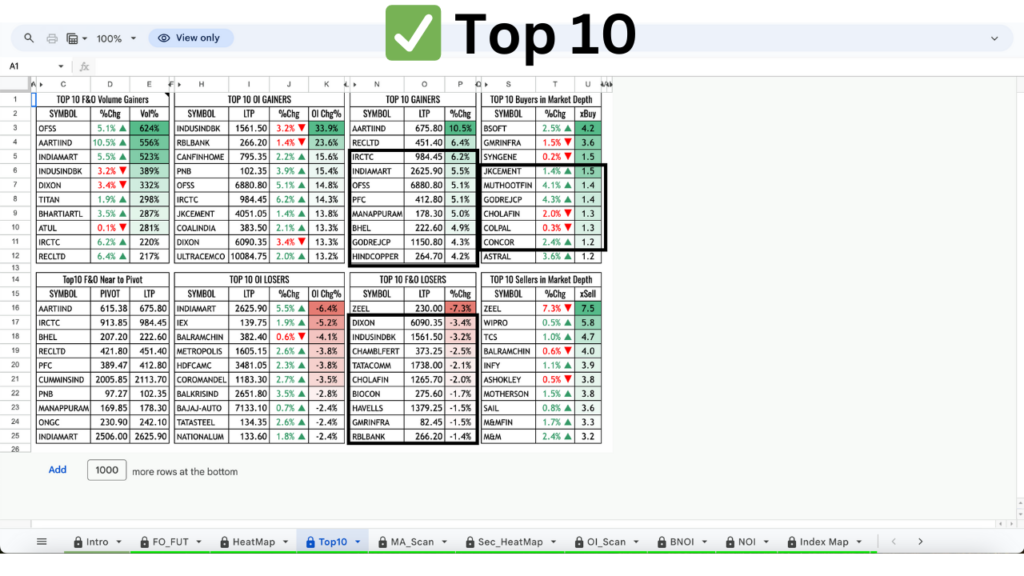
- Drill Down to Stock-Level Analysis
Zoom into individual stocks within the identified sectors. Assess their performance and trading volume to spot potential opportunities.
- Simulate Trades with the FNO Calculator
For selected stocks, input trade parameters into the FNO Calculator. Analyze profit and loss scenarios, break-even points, and margin requirements.
- Evaluate Market Sentiment
Use the heat map’s overall color distribution to gauge market sentiment. Combine this with the FNO Calculator’s results to align your strategy with market dynamics.
- Develop a Holistic Trading Strategy
Leverage insights from both tools to craft a strategy. For instance, capitalize on bullish sectors or hedge risks in bearish markets by using options.
Practical Applications
- Intraday Trading
Sector heat maps help identify high-volatility sectors for intraday trades, while the FNO Calculator fine-tunes entry and exit points.
- Sector Rotation Strategies
Monitor sector heat maps to identify rotation patterns. Use the FNO Calculator to assess trades within newly emerging sectors.
- Risk Mitigation
Combine heat map trends and FNO calculations to hedge against sector-wide risks.
- Long-Term Investment
For long-term investors, heat maps highlight promising sectors, while the FNO Calculator ensures well-planned futures and options trades.